

- Home
- >
- FX Daily Forecasts
- >
- USD/CHF: A number of positive signals for possible long

USD/CHF: A number of positive signals for possible long
Rating:

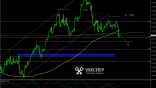
USD/CHF: D1 Graph - The move is long and short term correction.
FIBO correction to 61.8% of the long move up
Bullish hummer at levels of support - Reversing formation
Break up of horizontal resistance and diagonal resistance - signal for long
Higher high, possible change in trend, a long trend after break above 0.9786
Price moves up above 25 ЕМА and at the same time RSI moves up above 50
CCI(50) above 0
SL: 0.9739
Alternative scenario: If the price moves below 0.9739 will cancel the bullish formation.
Sentiment: The expectation of the FED raising rates are growing and this can support the USD
Stefan D. Angelov - Head of Stocks Trading
 Varchev Traders
 Read more:


RECCOMEND
WAS THIS POST USEFUL FOR YOU?
If you think, we can improve that section,
please comment. Your oppinion is imortant for us.
If you think, we can improve that section,
please comment. Your oppinion is imortant for us.

