

- Home
- >
- FX Daily Forecasts
- >
- USD/CHF: Break of the Triangle and test of the horizontal resistance

USD/CHF: Break of the Triangle and test of the horizontal resistance
Rating:

USD/CHF:
Date: 23 September, 2016
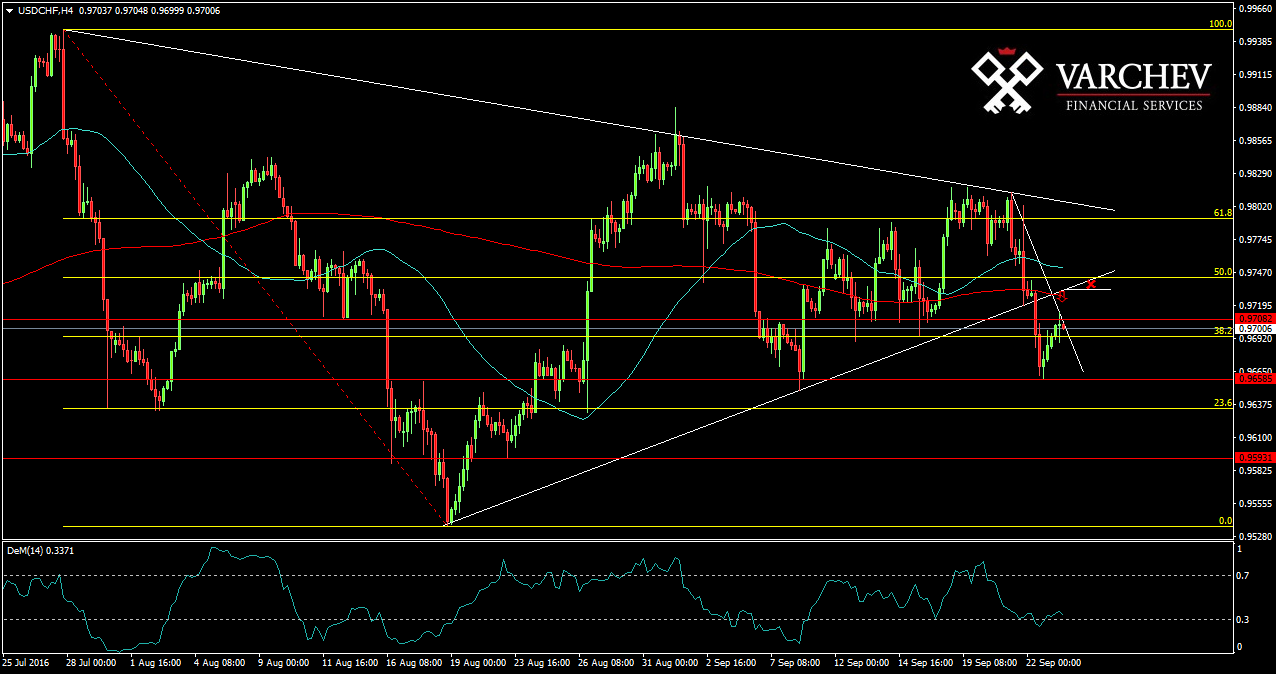
H4 Graph: Medium term short trend, break of large consolidation - Triangle formation
The price forms 3rd lower high below the long diagonal resistance line. After that the price comes out/break of the triangle and also breaks horizontal support on the down side, which becomes resistance at 0,97100. Now the price comes back to test the horizontal resistance and the break.
Price Action: Doji bar at horizontal resistance - Сигнал за шорт

Alternative scenario: If the price goes up again above the horizontal resistance above the 0,97100 will cancel the bearish view.
Technical Indicator:
DEM (14) - In the vicinity of the oversold zone
Price for Entry short: 0,97100
SL: 0.97400
Jr. Trader - S. Fuchedzhiev
 Varchev Traders
 Read more:


RECCOMEND
WAS THIS POST USEFUL FOR YOU?
If you think, we can improve that section,
please comment. Your oppinion is imortant for us.
If you think, we can improve that section,
please comment. Your oppinion is imortant for us.

