

- Home
- >
- FX Daily Forecasts
- >
- USD/CHF: Long Trend and possible new long position after correction

USD/CHF: Long Trend and possible new long position after correction
Rating:

USD/CHF:
Date: 12 October, 2016
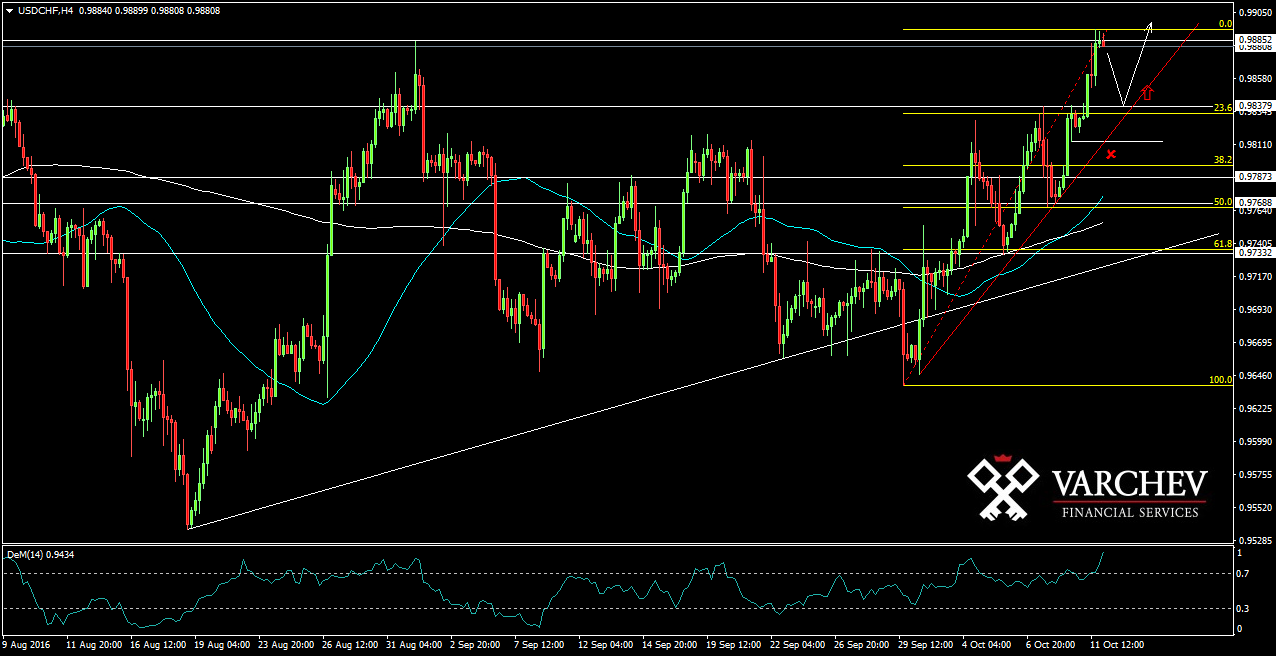
H4 Graph: Medium Term Long Trend
The price reached previous high at 0,98900 and now it may be ready for a short correction, down to the last support, which was broken resistance as the price was moving up. This levels is the same as the Fibo 23,6% as well. Possible good place for a new long position after correction down to horizontal and diagonal support and Fibo level. It is important to wait and see price action signal for long.

Alternative Scenario: if the price does not stop and continue down and moves below the horizontal support and 0,9800, this may cancel the bullish view
Technical Indicator:
DEM (14): In the overbought zone
Price for Entry long around: 0,98350
SL: 0.9800
Jr. Trader - S. Fuchedzhiev
 Varchev Traders
RECCOMEND
WAS THIS POST USEFUL FOR YOU?
If you think, we can improve that section,
please comment. Your oppinion is imortant for us.
If you think, we can improve that section,
please comment. Your oppinion is imortant for us.

