

- Home
- >
- FX Daily Forecasts
- >
- USD/CHF possible price decrease

USD/CHF possible price decrease
Rating:

Forex forecast / USD/CHF / Our expectations
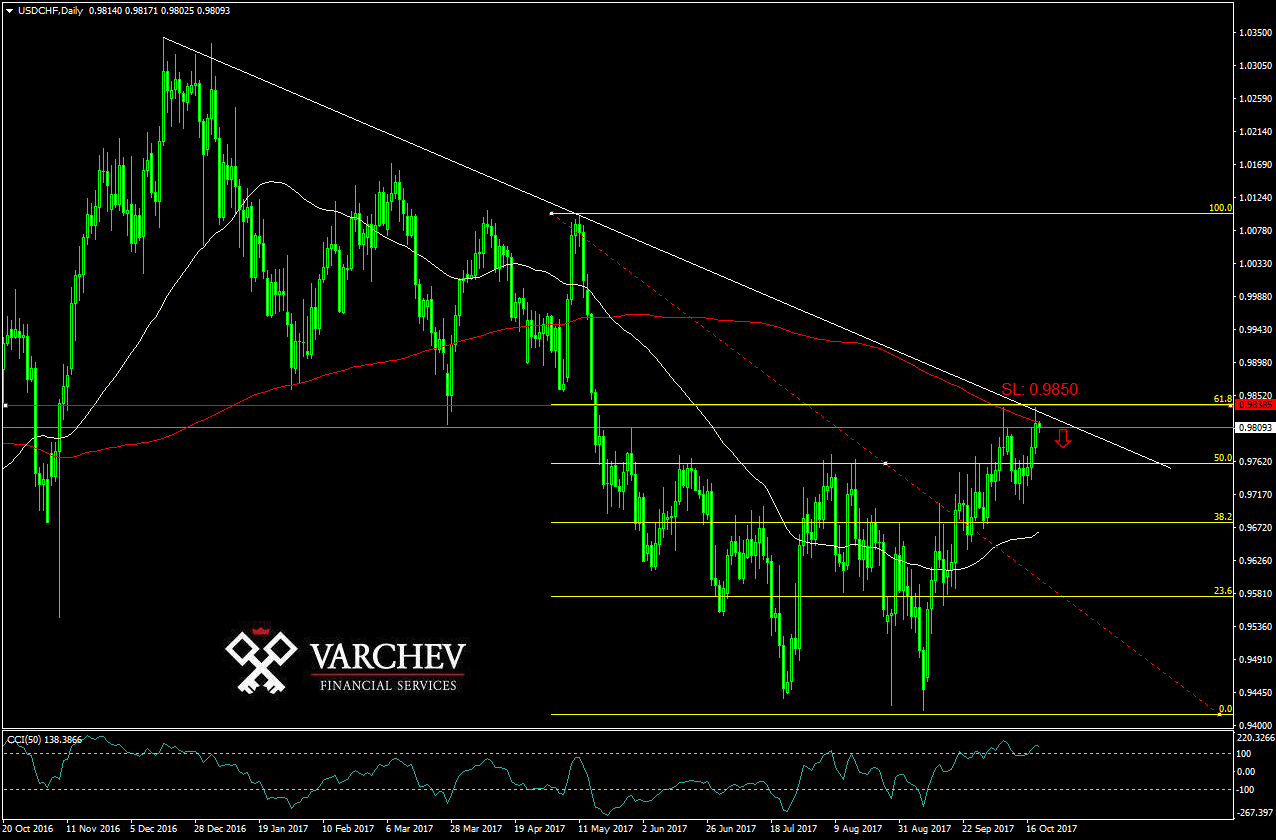
Longterm downtrend, the price entered in consolidation in the middle ot 2017 and now is in the upper part of the channel in proximity of diagonal and horizontal resistance and FiBo 61.8. Price action signal: Tweezers at levels of diagonal resistance and FiBo 61.8. The price made fake break out of SMA 200 and afterwards pulled back below the moving average which is considered negative signal. Technical indicator: CCI(50) - In zone of overbought and turning down - when break level 100 the negative sentiment will be confirmed.
Alternative scenario: If the price breaks below the zone of resistance, the negative scenario will be dismissed.
SL: 0.9850
Trader Bozhidar Arabadzhiev
 Varchev Traders
 Read more:
 AUDUSD: key levels where we are looking for short positions
 AUDUSD bounces off the resistance zone despite the positivism during the Asian hours
 EURUSD in a tight range during the Asian session
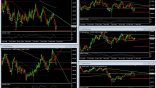 EUR in a recovery mode, but vulnerable | Technical levels
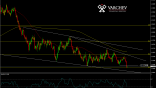 EURUSD continues ranging in the early EU session. NFP data in focus at 15:30
RECCOMEND
WAS THIS POST USEFUL FOR YOU?
If you think, we can improve that section,
please comment. Your oppinion is imortant for us.
If you think, we can improve that section,
please comment. Your oppinion is imortant for us.

