

- Home
- >
- FX Daily Forecasts
- >
- USD/CHF possible short after correction

USD/CHF possible short after correction

Rating:

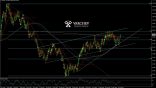
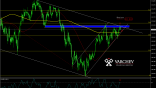
USD/CHF 13.20.2016 D1 chart:
Downtrend and mid term choppy.
Price below 50% Fibonacci of the downtrend.
Diagonal resistance and zone of horizontal resistance.
Price action: bearish engulfing and 2 and two equal ticks up (last bar still not closed but it will very likely close with engulfing) - strong negative signal.
Technical indicators:
DeM(14) reverses above 0,7 in overbought zone - sell
Entry after 50% correction of the current bar with goal to minimize risk or now.
SL 0.9960
Alternative scenario: Price above the resistance zone will negate the negative scenario.
Jr. Trader Nikolay Georgiev
 Varchev Traders
 Read more:

RECCOMEND
WAS THIS POST USEFUL FOR YOU?
If you think, we can improve that section,
please comment. Your oppinion is imortant for us.
If you think, we can improve that section,
please comment. Your oppinion is imortant for us.

