

- Home
- >
- Opportunities for profit today
- >
- USD/JPY: increased attention, price on resistance levels, but there is a possibility for H&S formation

USD/JPY: increased attention, price on resistance levels, but there is a possibility for H&S formation
Rating:

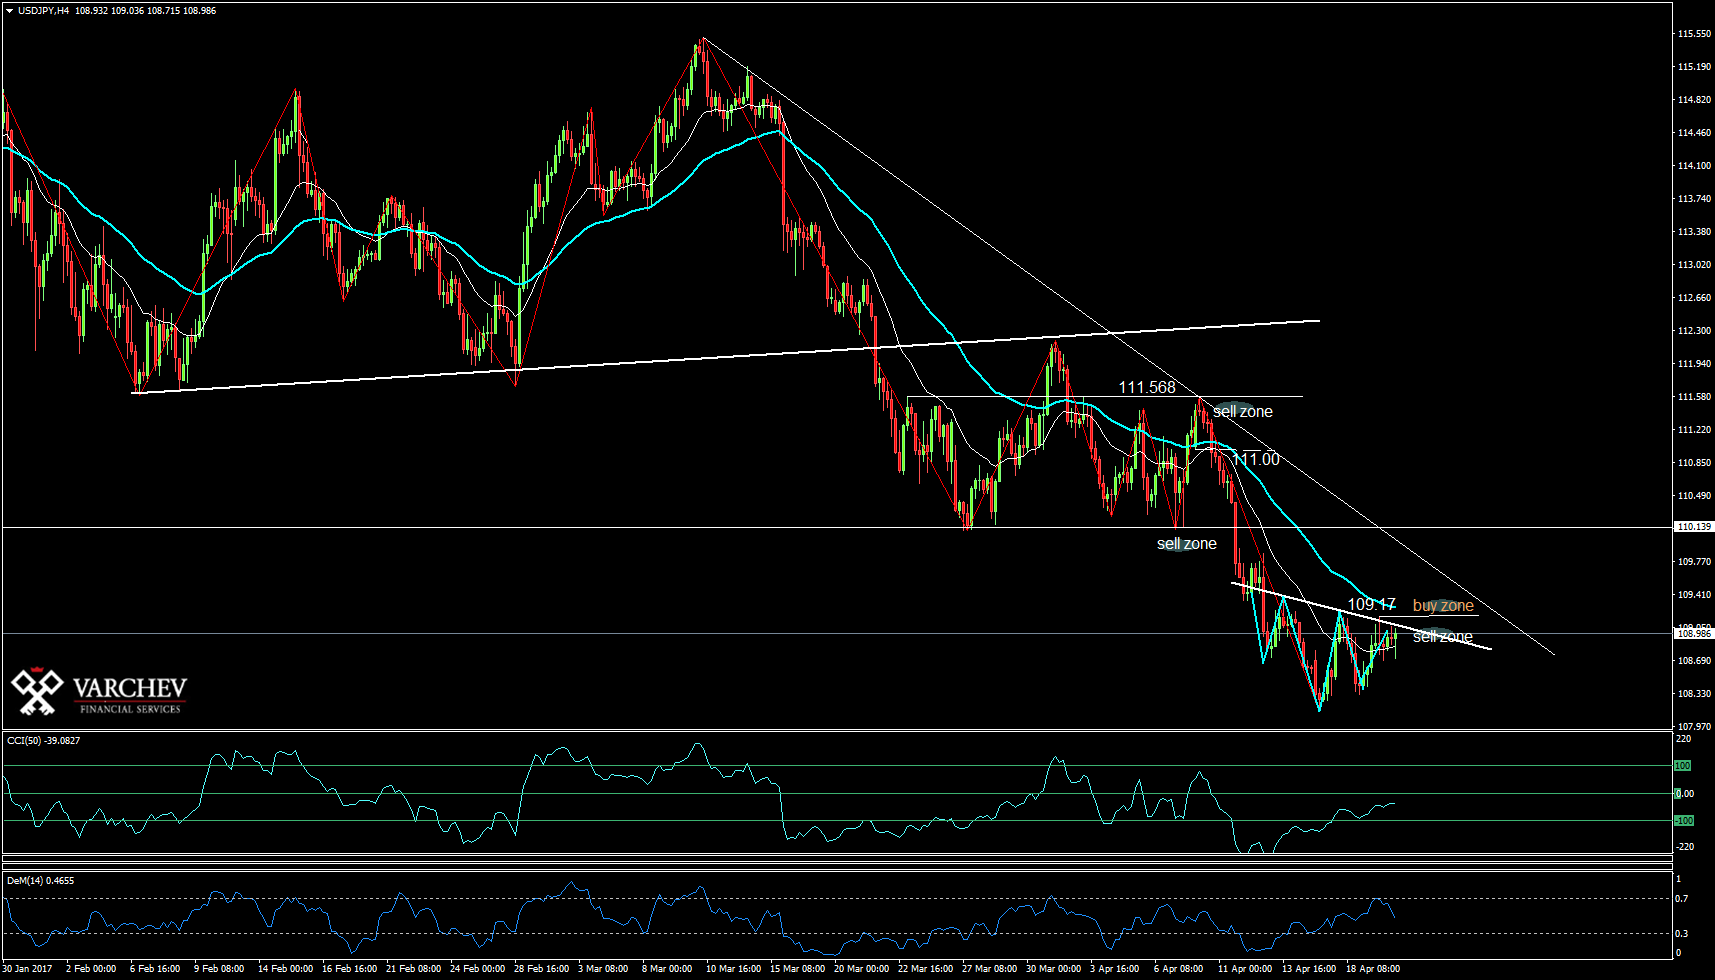
USD/JPY: mid-term downtrend.
Price around horizontal and diagonal resistances below 109.17. While the price is below this level, the short movements are more likely.
Indicators still show the prevailing of the bearish sentiment.
A possibility for a "Head and Shoulders" formation, which increases the potential but only if price breaks above 109.17
The current candle bar has long lower shadow - bullish signal.
Breakout above 109.17 will give a signal for long with a stop just below the bottom of the current candle bar or around 108.50
Stefan D. Angelov - Head of Stocks Trading
 Varchev Traders
 Read more:


RECCOMEND
WAS THIS POST USEFUL FOR YOU?
If you think, we can improve that section,
please comment. Your oppinion is imortant for us.
If you think, we can improve that section,
please comment. Your oppinion is imortant for us.

