

- Home
- >
- FX Daily Forecasts
- >
- USD/JPY probable downward movement

USD/JPY probable downward movement
Rating:

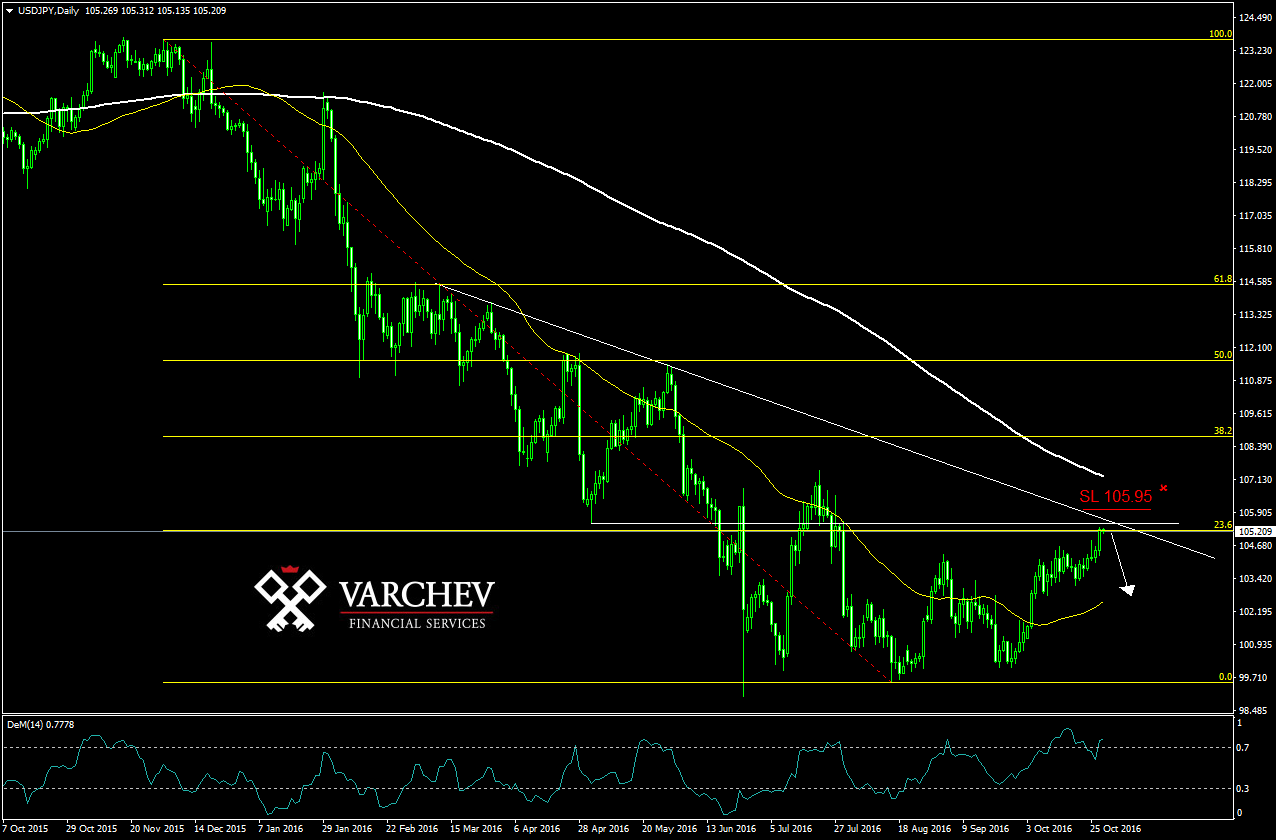
USD/JPY 28.10.2016 D1 chart.
Long term downtrend and correction to 23.6 Fibonacci.
Price below horizontal and diagonal resistances.
Japanese candle sticks signal: Dodji bar on H4 and price below the bottom shadow for probable downward movement
Technical indicators:
DeM(14) above 0,7 - overbought market, as reverse downward will confirm the short.
Sentiment: Latest declines by the indexes and in oil prices will support yen and on the other hand US dollar is overbought and might make a correction.
SL 105.95
Alternative scenario: If price goes above the resistances this will negate the negative scenario.
Jr. Trader Nikolay Georgiev
 Varchev Traders
 Read more:


RECCOMEND
WAS THIS POST USEFUL FOR YOU?
If you think, we can improve that section,
please comment. Your oppinion is imortant for us.
If you think, we can improve that section,
please comment. Your oppinion is imortant for us.

