

- Home
- >
- FX Daily Forecasts
- >
- USD/JPY upward movements will likely continue

USD/JPY upward movements will likely continue
Rating:

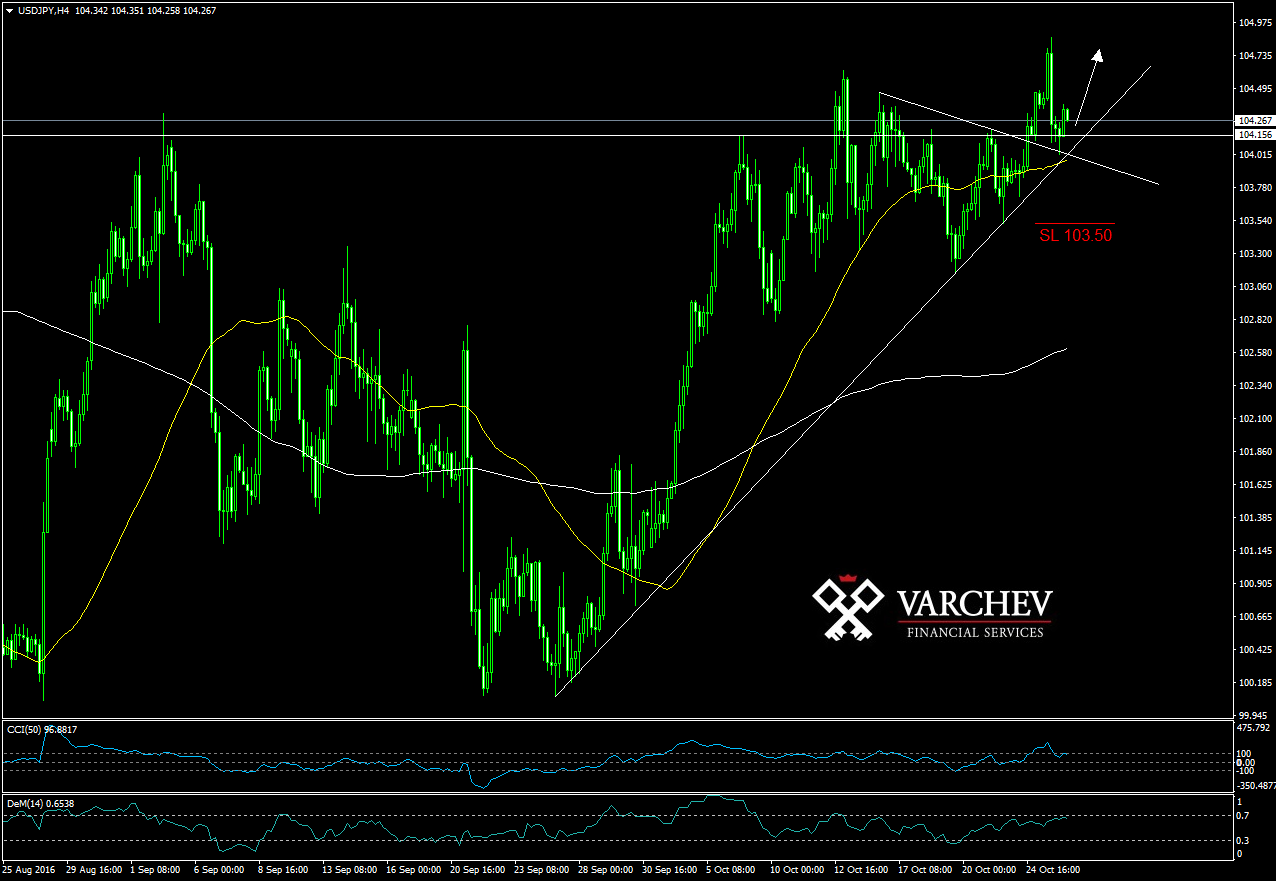
USD/JPY 26.10.2016 H4 chart.
Short term uptrend and correction.
Price close and above horizontal and diagonal supports.
Second test of the neckline of the reversed Head and Shoulders - trend confirming formation.
Candle sticks formation: pin bar at levels of support and bullish engulfing bar
Technical indicators:
CCI(50) below 100, as crossing above 100 will confirm the long signal
Price above SMA50 and SMA200 ordered in bullish formation - positive signal
SL 103.50
Alternative scenario: If price goes back below supports this will negate the positive formation.
Jr. Trader Nikolay Georgiev
 Varchev Traders
 Read more:


RECCOMEND
WAS THIS POST USEFUL FOR YOU?
If you think, we can improve that section,
please comment. Your oppinion is imortant for us.
If you think, we can improve that section,
please comment. Your oppinion is imortant for us.

