

- Home
- >
- FX Daily Forecasts
- >
- USD/TRY: Possible continuation of the long, but only after break up above horizontal resistance

USD/TRY: Possible continuation of the long, but only after break up above horizontal resistance
Rating:

USD/TRY:
Date: 2 March, 2017
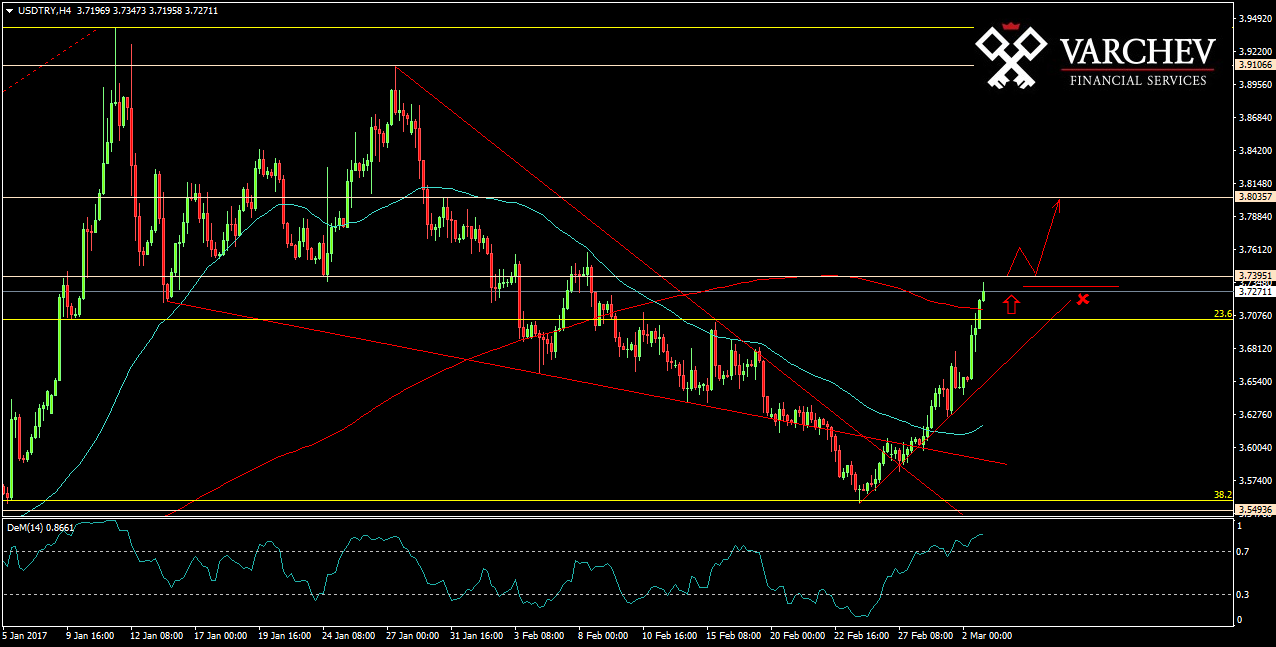
H4 Graph: Long term trend long, Medium term long move
Price of the pair made a correction at the bigger picture and stopped exactly at FIB 38,2% and again started moving up. Now the price is close to horizontal resistance, and this horizontal zone is very important. If there is a break above it, it is quite possible that the long can continue. Price is above 50 EMA and 200 ЕМА and the trend is long.
DEM: In the overbought zone
Alternative scenario: If after the break of the horizontal zone around 3.7400, price again drops down below it, then the bullish scenario might be at risk.
Price for Entry long around: 3,73800 but only after a clear break up and retest of the horizontal support.
SL: 3.72800
Trader: S. Fuchedzhiev
 Varchev Traders
 Read more:


If you think, we can improve that section,
please comment. Your oppinion is imortant for us.

