

- Home
- >
- FX Daily Forecasts
- >
- USD/TRY: support break, possible decrease

USD/TRY: support break, possible decrease
Rating:

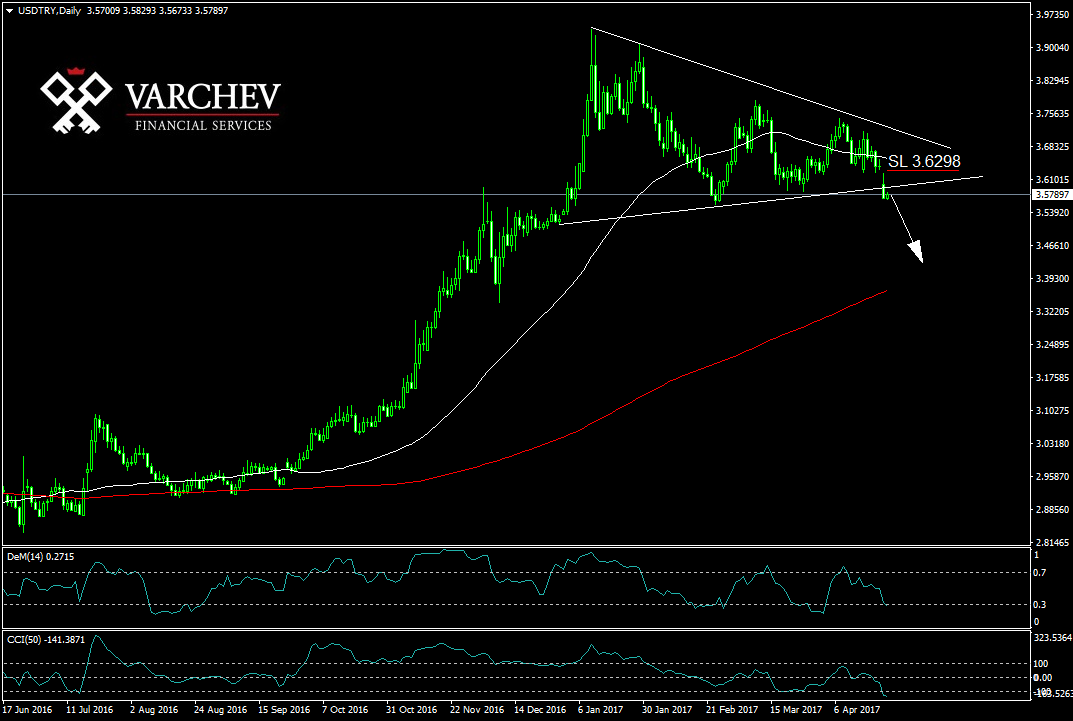
USD/TRY: Daily chart - triangle formation
Price under diagonal and horizontal resistance
Breakthrough of the supporters - possible decline
Indicators:
50/200MА: price below 50MА - negative signal
DeM: It's entering in over-sold market - a downward impulse is possible.
CCI(50): In Over Sales Zone
SL: 3.6298
Alternative Scenarios: If the shadow price of the previous bar is likely to witness a false breakthrough and a new upward movement
Trader I. Ivanov
 Varchev Traders
 Read more:


RECCOMEND
WAS THIS POST USEFUL FOR YOU?
If you think, we can improve that section,
please comment. Your oppinion is imortant for us.
If you think, we can improve that section,
please comment. Your oppinion is imortant for us.

