

- Home
- >
- Daily Accents
- >
- VIX vs SPX …

VIX vs SPX ...
Rating:

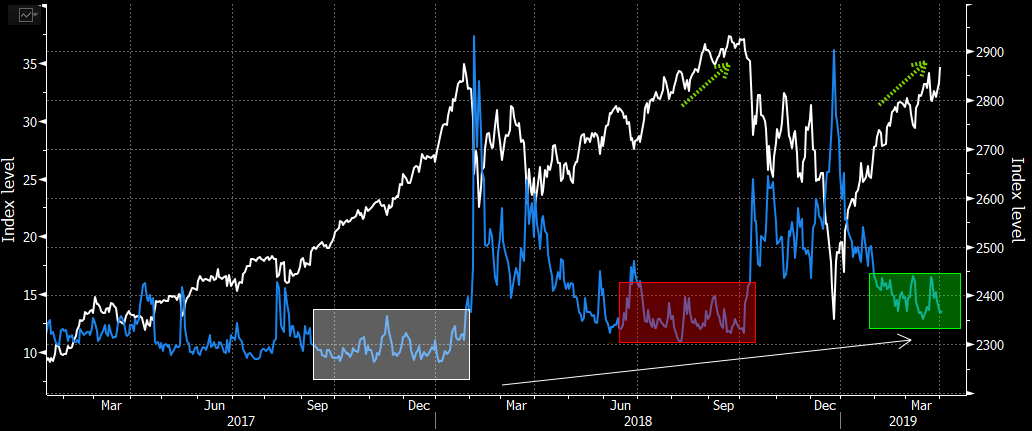
"The Cboe Volatility Index has yet to confirm the equity rally as it hasn’t formed a lower low to match the U.S. stock benchmark’s higher high".
That's not really how it works. Volatility and VIX move in cycles as well. As you can see in the chart below, the VIX can make higher "plateaus" and be trading higher when SPX "is at the same level". More importantly is to watch the VIX futures curve and other measures that give more and deeper insight on volatility, than just simply comparing levels of VIX here vs SPX.

Chart: Used with permission from Bloomberg Finance L.P.
 Trader Georgi Bozhidarov
 Read more:


RECCOMEND
WAS THIS POST USEFUL FOR YOU?
If you think, we can improve that section,
please comment. Your oppinion is imortant for us.
If you think, we can improve that section,
please comment. Your oppinion is imortant for us.

