

- Home
- >
- Uncategorized @en
- >
- Warning: Don’t Buy Stocks Now; Market Set for Fall, These Charts Show

Warning: Don't Buy Stocks Now; Market Set for Fall, These Charts Show
Rating:

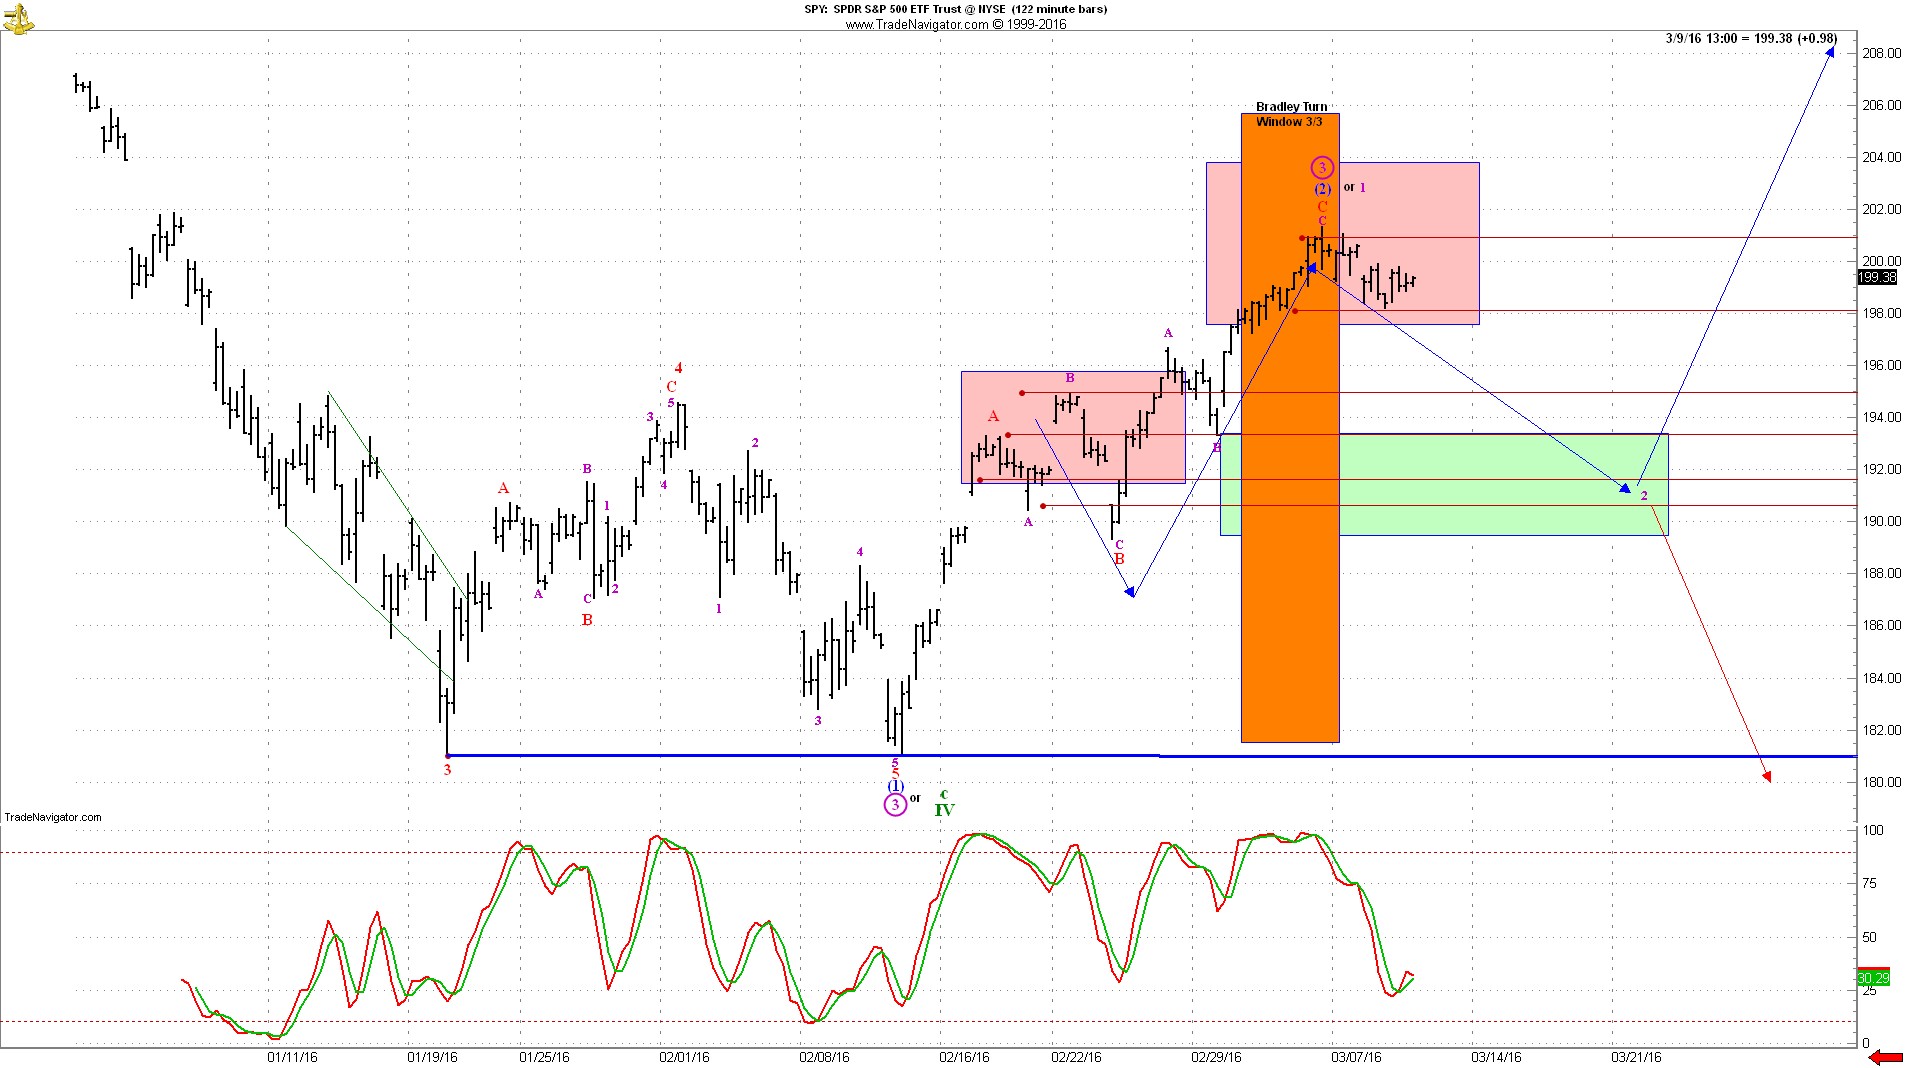
Here's the 2-hour bar chart of the SPDR S&P 500 ETF Trust (SPY) , an exchange-traded fund that tracks the benchmark S&P 500 index. It has been rising strongly since the February double bottom at $181, which was also the low of Jan. 20. The problem, from a pattern-recognition perspective, which is something we monitor in our live-market Trading Room, is that after a huge double bottom, the historic expectation would be for a monster rally that conforms to the guidelines of Elliott Wave theory (a five-wave rise with orthodox intra-wave symmetry).

What has taken place off the February low is only half of the expectation, however. Yes, it's a monster rally, with 20 SPDR S&P 500 ETF Trust "handles" in a month, but it has manifested only three large waves. Even if the next few hours/days produce a short-lived thrust toward $203, the larger schematic will still only qualify as a corrective structure. Once complete -- if it's not already complete -- the correction should be followed by a decline toward the sweet spot of the green box: $192 +/-$2. Then, the next decision point will arrive. The ETF could follow either the red arrow down or the blue arrow up. Either way, the ETF will first make the trip to that green box, so now is not the time to be buying or holding stocks, especially if you're buying them on margin.
More importantly, our decision support engine's algorithms look for cause/effect relationships that are highly predictive. The up/down/up pattern labeled in the chart with the red ABC shows that the rise from the February low to the March 4 high is not impulsive. Impulsivity is a requirement for the February low to be deemed as the final low in the decline that began at the May 2015 peak. A lack of impulsivity means that the most recent low likely will be broken. Therefore, either this pattern morphs into an impulsive rise in a big hurry, or the green box will have no chance of containing the coming selloff
The Street...
 Varchev Traders
 If you think, we can improve that section,
please comment. Your oppinion is imortant for us.

