

- Home
- >
- Stocks Daily Forecasts
- >
- Warning signs are piling up that the bull run in stocks is nearing an end

Warning signs are piling up that the bull run in stocks is nearing an end
Rating:

If it feels like this bull market has been going on for a long time, that's because it has.
In fact, the current market rally, which has lasted 2002 trading days, is the longest one since the rally that preceded the 1929 stock market crash.
Coincidentally, that rally lasted 2002 days.
So does that mean the market will crash on Friday, February 17?
Probably not. But the coincidence raises an interesting question that has a lot of Wall Streeters asking: will this rally ever end?
Michael Paulenoff is the president of Pattern Analytics. He told Business Insider that there are some indications that a correction is on the horizon. He said declining volume in the stock market is one red flag.
In the two weeks leading up to the election about 743 million shares change hands on the New York Stock Exchange each day. So far this year NYSE volume is averaging 660 million. That compares to an average of 772 million during all of 2016.
"For decades rising volumes have preceded a rise in prices in the stock market. Likewise, declining volume leads to a decline in prices,"Paulenoff said.
"Right now volumes are 50% lower in the S&P than they were in the weeks leading up to the November election when the markets saw a streak of declines," he added.
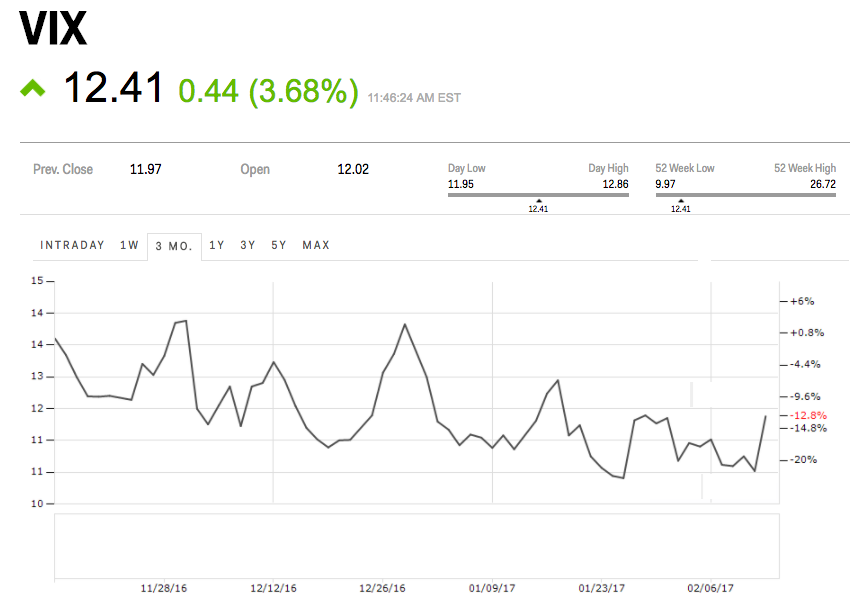
The current position of the Chicago Board Option's Exchanges Volatility Index — or VIX — is another indication that the stock market is unhealthy. The VIX is basically a measure of expectations for future stock volatility, so when stocks are rising, and people feel good, the VIX moves lower. During a sudden selloff, it spikes.

Right now the VIX is at 12.41, down from where it stood the day before the Presidential election — after which stocks began a determined push higher that took all three US benchmarks into record territory.
But Paulenoff said the current levels are actually mismatched. The VIX isn't low enough.
"The VIX is all messed up," Paulenoff said."We are somewhere around 11 and 12 when we should be at 8."
In a recent note, he noted that the VIX has actually climbed in February even as the S&P 500 rose to record highs. He noted that this suggests "extreme caution" among stock investors.
And Paulenoff isn't the only one who is seeing red flags. A note by investment firm Raymond James sent out to clients on February 15 provides more evidence that the rally may be nearing its end.
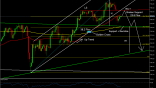
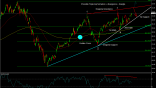
Using Fibonacci levels, a technical analysis tool used by traders 'to identify strategic places for transactions to be placed, target prices or stop losses,' Raymond James identified the resistance point for traders to exit the market the S&P 500 at around 2,335, right above the current level of 2,349.

Plenty of people are skeptical of technical analysis, but it wouldn't be the first time the Fibonacci levels got it right.
"The index ran up into uncharted territory and continued making new highs until just below the 2135 level where the Fibonacci extension was sitting. Of course, after stalling out at this point, the market continued to struggle over the next several months, culminating in the February 2016 low," the note said.
 Varchev Traders
 Read more:


If you think, we can improve that section,
please comment. Your oppinion is imortant for us.

