

- Home
- >
- Daily Accents
- >
- What can history tells us about the future of the markets?

What can history tells us about the future of the markets?
Rating:

Markets always create a reason for a debate between buyers and sellers about the future share price.
At the moment, however, Wall Street spends a lot of time debating which year of the year resembles a maximum of 2019 - and what this means for future prospects.
Historical models and references to major market events from previous cycles are always an interesting subject for investment commentary. But until 2019 continues to be revealed to us, a number of strategists are emerging, who are making the past, concrete years, in order to make a useful use of the markets now.
1988

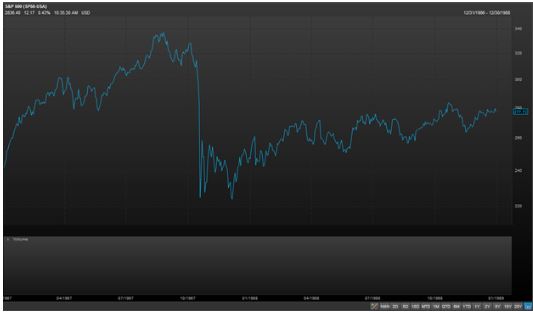
Long-time market strategist Barry Knapp in his Ironsides Macroeconomics made an expanded comparison from 2018 to 2019 to 1987 - 88. In 87, the bull market, which lasted for several years, reached new historic peaks at a time when the US economy accelerated significantly. However, there has been a major reform in tax legislation.
The FED tightened the monetary policy aggressively, and the president "put on a conveyor" any kind of trade protectionism against Japan's highly export-oriented and economic power. The shares reached an unprecedented extreme, and the resulting correction became a collapse, mostly due to previously untested commercial practices.
But the October crash of 87 did not recession, the Federals changed the course to loosening politics, and the shares recovered the losses for the rest of the year - until a short recession did not occur in 1990.
We have seen a similar rise in shares after tax cuts, which led to over-overestimation earlier in the year, followed by a quarter-final collapse amid a tightened Fed and US-China trade sparks. All of this has been further eradicated by strategies involving short-term volatility (in February) and aggressive actions by hedge funds (December).
1995

Tony Dwyer of Canaccord Genuity is the person who constantly compares the market with this analogy, which is surely the most striking analogy relating to the S & P500, which was strongly demonstrated in 1995 when S & P rose 35% without even a correction of at least 5 %. In 1994, FED aggressively stepped up short-term interest rates to outperform inflation, raising the base rate from 3% to 6% at the beginning of 1995. During that time, economists expected unemployment to fall below 6% and perceived as a threat to inflation. The yield curve became completely flat (yields of 2 and 10-year olds became totally equal). The shares moved aside during the year, but small-caps had entered the bear market, and the shares of the banks collapsed. There has been a "bear market in the shade".
At the beginning of 1995, the US economy showed clear signs of delays. Fed chairman Alan Greenspan signaled that fiscal tightening would likely begin, and in fact, FED cut interest rates at a time when GDP fell below 1%. Until then, the shares "caught the hint": a boom in productivity, growth returned without much inflation, and volatility boomed.
In his speech last summer, President Jerome Powell explicitly commended Greenspan's decision to stimulate the economy. In a sense, the conditions were the same in 2013 as in 1955. The financial markets melted by 30%, overshadowed by the fear of growth and interest. But the bulls can at least hope that Powell will be able to influence the markets as Greenspan did 24 years ago.
2009

Tom Lee of Fundstrait is the only one who thinks that this year will be like 2009. And it goes without saying: In the beginning of 2009, the shares made a dramatic turn after the S & P500 reached a 12-year low at the end of one of the worst recessions in the past 70 years. The decline from last quarter, within the fast 20% to 20-month low, while GDP stands at 3%, is hardly comparable.
However, this scenario opens up some preconditions under conditions that resemble the time and now: Fall-style "waterfall" in the shares, making a new bottom; high yielding bonds reporting a rare negative annual return (2018 and 2008); "no-stop negative sentiment" even after the stock rebound; dovish FED.
2016

This is the freshest scenario and perhaps the best given as an example by investors. The S & P500 made a new historic peak in early 2015, before oil prices collapsing and China's problems and emerging markets are booming. This created a real industrial contraction that sent corporate earnings to red territory for several reporting periods in a row. (Like 2018 with the crisis in emerging markets and fears of recession). FED desperately struggled to normalize politics in 2015 and slipped a rather controversial rise in interest rates in December, then immediately paused and held interest rates for a full year.
Profitability remained within limits, dividend shares and growth-driven sectors led the market up higher, while the world was expecting the Brexit referendum. For the moment, the 2016 analogy works, given that we do not have elections in 2019 to reverse the story entirely from weak growth, fiscal constraints, the risk of weakening tax breaks, deregulation, and increasing economic activity. For the time being, however, markets are behaving as in the first half of 2016.
2000

Most of the historical examples reveal conditions where at first glance things looked devastating, but in the end the markets have survived for at least several years. But the bear observers do not stay behind with their dark predictions.
Economist David Rosenberg from Gluskin Sheff points out that the latest economic data and market releases - such as weak retail sales and rising claims for unemployment, the rally in shares after a 20% drop - are not in line with business cycles and peaks in bull markets like 2000 .
Another booming moment since 2000 is the dominance of technology stocks that led tech stocks to their latest record in September. The relatively strong labor market and economic activity of households are similar. The recession of 2001-02 and the bear market has hit the worst of the corporate sector, tech industry and stock investors more than workers and the middle class. Disagreeable, but the next drop may awaken some similar features.
Source: CNBC
 Trader Martin Nikolov
 Read more:
 Risk off after the escalation in the Middle East, markets are recovering in a period of calm
 The macroeconomic events for today’s trading calendar
 The US government has confirmed the attacks, Trump is calling an emergency staff meeting
 Has the war between Iran and the US started?
 US markets remain under pressure, traders await Iran’s response
If you think, we can improve that section,
please comment. Your oppinion is imortant for us.

