www.varchev.com

What data is published by Amazon and what to expect

Amazon Price chart

Rating:

12345
Loading...

What did Amazon show in 2017?
- The company's revenue jumped to $ 60.5bn. compared to $ 59.83 billion. expected
- EPS of the company came out as expected: $ 3.75 per share.
- AWS (Amazon Web Services) revenue rose to $ 5.11bn. compared to the expected $ 4.97 billion. AWS remains the best performing company in the Amazon group and at the same time a major source of revenue in North America.
Amazon's revenue jumped 38%, with US growth of 42% and US 29%.
A quick look at the Supply Chain analysis shows that Sony's sales peaked at 10.85%, while sales at General Electric dropped by -6.99%.

Amazon Supply Chain:

Amazon supply chain analysis

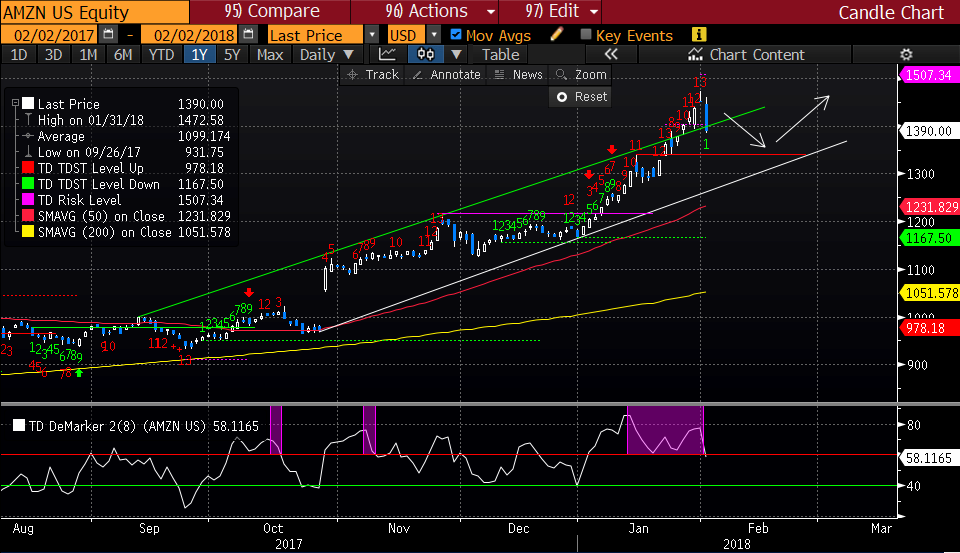
Technical look where is the best entry point?

The technical price is in a strong upward trend, but there are several worrying signals that will most likely negatively impact despite the company's good financial data. Given the negative sentiment of stock markets over the past few days, we expect Amazon to remain under pressure as the $ 1,350 levels where the first level of support is available give us a good opportunity to position ourselves with long-term trends. Currently we have a Sequential with 13 at the top - an upward trend signal. Sequential counts 1 bottom - beginning a new downward impulse. Dem 8 puts a sales alert pointing down and coming out of an oversupply zone - negative for the price.

Keep in mind that Amazon trades with + 6% after the stock market. In other words, tomorrow the price will open with Gap in the upward direction.

Amazon Price chart

Source: Bloomberg Pro Terminal

Jr Trader Petar Milanov


 Varchev Traders

Read more:

RECCOMEND WAS THIS POST USEFUL FOR YOU?
If you think, we can improve that section,
please comment. Your oppinion is imortant for us.
WARNING: Any news, opinions, research, data or other information contained within this website is provided as general market commentary and does not constitute investment or trading advice. Varchev Finance Ltd. expressly disclaims any liability for any lost principal or profits which may arise directly or indirectly from the use of or reliance on such information. Varchev Finance Ltd. may provide information, quotes, references and links to or from other sites and blogs and other sources of economic and market information as an educational service to its clients and prospects and does not endorse the opinions or recommendations of the sites, blogs or other sources of information.
Varchev Finance

London


25 Canada Square, Level 33, office 50, Canary Wharf London, E14 5LQ +44 20 3608 6256

Universal numbers

World Financial Markets - 0700 17 600    Varchev Exchange - 0700 115 44

Varchev Finance Ltd is registered in the FCA (FINANCIAL CONDUCT AUTHORITY) with a passport in the United Kingdom: FCA, United Kingdom - registration number: 494 045, which allows provision of financial services in the United Kingdom.

Varchev Finance Ltd strictly comply with the statutes of the European directive MiFID (Markets in Financial Instruments). targeting increased efficiency, transparency and uniformity of financial instruments.
Varchev Finance Ltd is authorized and regulated by the Financial Supervision Commission - Sofia, Bulgaria: License number RG-03-02-05 / 15.03.2006

The information on this site is not intended for distribution or use by any person in any country or jurisdiction where such distribution or use would be contrary to local law or regulation.


Disclaimer:

CFDs are complex instruments and come with a high risk of losing money rapidly due to leverage. 63,41% of retail investor accounts lose money when trading CFDs with this provider. You should consider whether you understand how CFDs work, and whether you can afford to take the high risk of losing your money.

chat with dealer
chat with dealer
Cookies policy