

- Home
- >
- Opportunities for profit today
- >
- What to trade during the Asian session – 17.10.2017

What to trade during the Asian session - 17.10.2017
Rating:

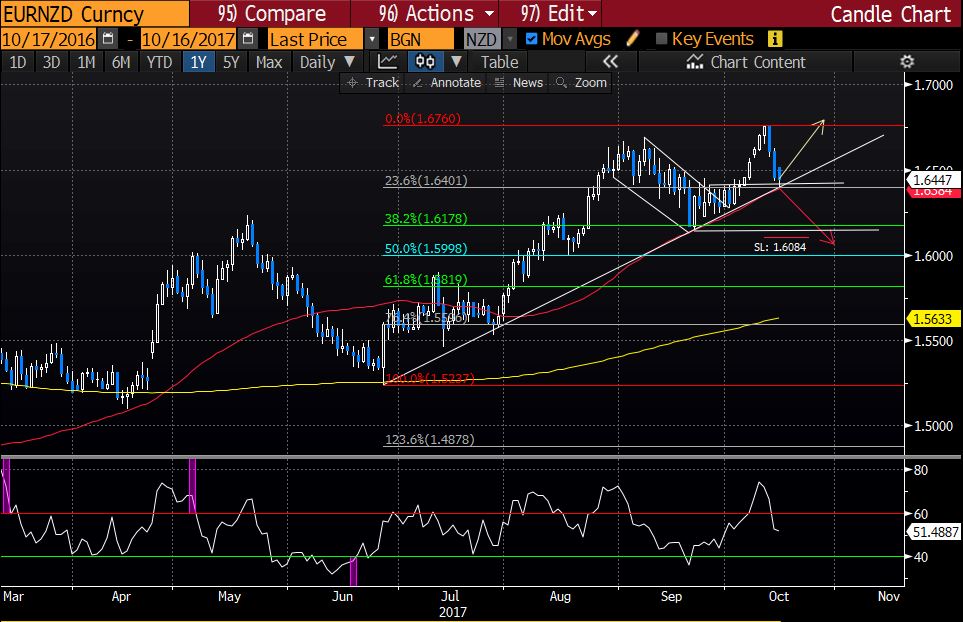
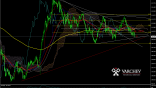
EUR/NZD D1
The pair price is in a medium-term upward trend and after correction to horizontal, diagonal and dynamic support level 50SMA coinciding with 23.6% Fibonacci correction of upward movement. Price levels are key, and traders will track for a breakthrough or an appropriate Price Action signal for long positions. Taking into account the upward trend that is still in force, our expectations are that the price will continue to rise. SL can be set to levels around 1.6084. However, if we see a breakthrough and keep the price below the level of support, then the positive scenario will break and we are more likely to see a decline.
During the Asian session, we expect important economic data from New Zealand - Consumer Price Index at 00:45 and the RBA meeting at 03:30. CPI estimates are positive, and if the actual data is better than expected, it is very likely that we will see a breakthrough in the upward trend after three black crows.
Chart 1 - EUR/NZD

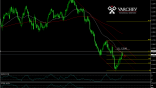
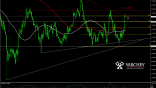
AUD/NZD D1
The price is in the long run and after a break in a medium-term upward trend. Correction to levels of horizontal resistance at the top of the long range and formation of a bearish bar - negative for the price. Our expectations are that, with better data from New Zealand, the momentum of the currency should be maintained. Input from the current levels requires a SL at the levels of about 1.1077, and the first target is the horizontal at 1.0850, and at break, and at 200SMA. If the price moves back above the horizontal resistance and stays there, the negative scenario will collapse and we are more likely to see growth.
Chart 2 - AUD/NZD

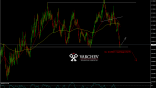
GBP/JPY D1
Despite the negativity behind Breckit's pounds, the GBP / JPY continues to rise, with GBP / JPY giving us good buy-out rates. The price tests a breakthrough on a triangle, first forming a swallowing bullish bar, then a bullish pin. Currently, it corrects up to 50% of the bullish pin bar and gives us a good opportunity for a short stop stop, which we can set at the level of about 146. If the price goes back under the horizontal and diagonal, the positive scenario will break and is more likely to observe a decrease.
Chart 3 - GBP/JPY

Jr Trader Petar Milanov
 Varchev Traders
 Read more:

If you think, we can improve that section,
please comment. Your oppinion is imortant for us.

