

- Home
- >
- FX Daily Forecasts
- >
- What’s ahead for the Australian dollar for the next year

What's ahead for the Australian dollar for the next year
Rating:

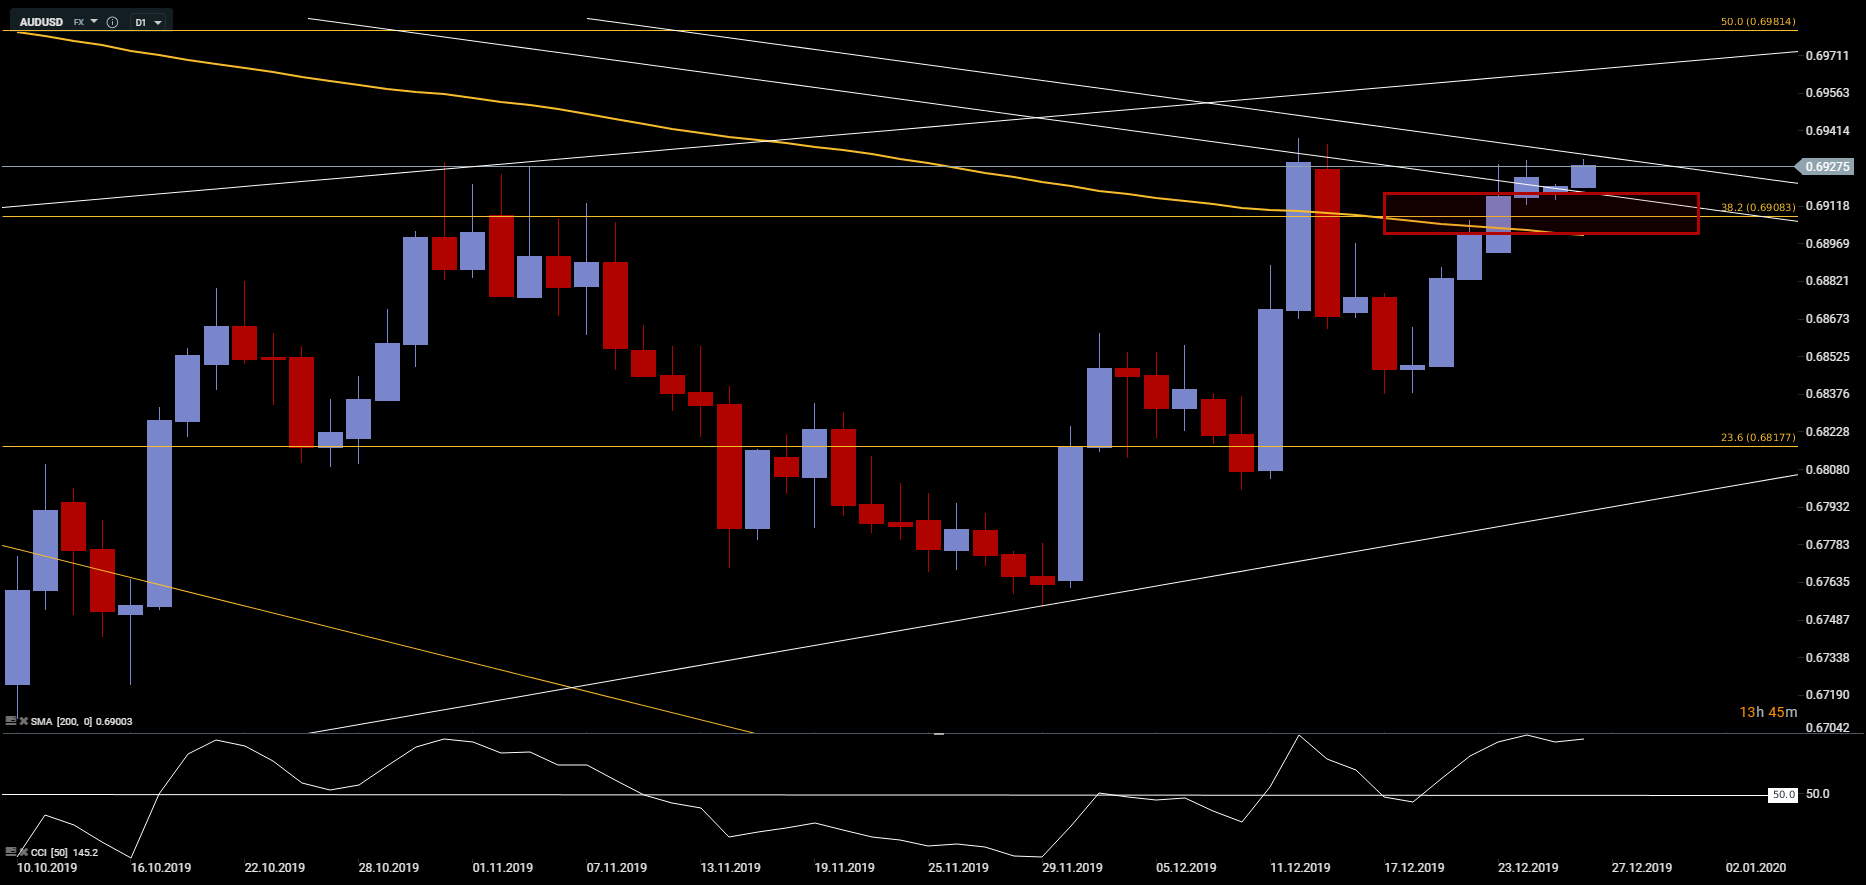
Earlier this week, AUD / USD passed over 200 periodic moving averages for the first time since March 2018.
In other circumstances, we would declare this a complete victory for the buyers and consider it a solidifying even trend-turning breakthrough. However, given the period in which we are now experiencing extremely low liquidity, this breakthrough may be completely false.
Knowing this, let's look at the reasons why the Australian dollar may become one of the most interesting currencies to watch as the new year approaches.

Mentioning above, the currency pair has crossed over 200 periodic and has closed above it several times in a row. Throughout 2019, the trend remained declining after each failed attempt to break above the moving average.
This has led to the slow and gradual depreciation of the Australian dollar in the face of a "glowing red" national economy, weak economic conditions in China and the weakening monetary policy of the RBA.
The problem here now is that the serious cash flows are still back, raising the likelihood that this breakthrough will turn out to be false.
But if, as liquidity improves next week, it pushes buyers to push the price even higher, above this key level, we would reasonably believe that, from a technical point of view, the breakthrough is real and the price will continue to rise even further. The area at 0.69887 seems like a good opportunity for the Bulls first goal. Break through there and detention will reveal the potential for an attack of 0.70000.
The fundamental picture.

The Australian Rally is in contravention of Australia's economic situation. The economy is in a difficult situation, which will remain at the beginning of next year. Economic growth remains depressed - GDP levels are at their lowest levels since 2009.
Household consumption remains rather low, which has cast a shadow over the economy for years. One of the brighter sectors of the economy is trade activity, which is improving at a minimum, even with more aggravating economic factors.
Recent economic data have continued to erode sentiment over the Australian economy.

In particular, however, the ballast is shaped by labor market data. In November, they came out better than expected. Despite the overall good data, if we look at the labor market in Australia in detail, there are some key elements of the sector that are not stable. For example, job growth is proving to be a temporary position, and the unemployment rate is still far from the desired RBA level of 4.5%.
Referring to the RBA, it is likely to be the first central bank to operate since early 2020, with a meeting on February 4.

With better labor market data coming out, cash rate futures have a reduced chance of a rate cut of 25 points to 38.3%. Before the data, this chance was 59%.
At this stage, however, we cannot completely reject the possibility of a reduction in interest rates - especially if the series of disappointing data continues in the coming weeks.
The problem for RBAs is that they have to try to revive the economy, while at the same time they have to convincingly drive inflation in the right direction.

However, as seen by CPI data, inflation has not moved since 2016 and RBA's target is 2 to 3%.
This factor, sluggish labor market and near-steady wage growth still support the idea that the RBA will cut interest rates in 2020, which in turn will raise the likelihood and speculation of launching QE as the bank approaches the lower limit of its interest rate range.
RBA President Philip Lowe said the central bank would only start considering QE if interest rates reached 0.25% (25 points below current levels), and a cut in February would move us one step further. .
With the formation of this sentiment on the part of the RBA, we can easily assume that AUD / USD will be driven by changes in interest rates next year.

Let's also look at the positioning of participants.

The market remains for the most part short against the Aussie, but not at its extreme levels since late last year, and in the middle of this one. This gives room for an extra short squeeze to create a buffer to maintain and increase short positions.
For seasonal models, January is rather an asymmetric month for AUD / USD.

The currency pair recorded a three-fold decline in January between 2014 and 2016, followed by three recordings of profitable monthly sessions for the same month in the period 2017 to 2019.
In February, the currency pair is more orderly than its seasonal pattern, with the currency pair increasing 11 in the last 15 years. There have been years of bad February, and with the RBA rhetoric we can expect surprises in February 2020. There are no guarantees.
I personally would not fully trust the seasonal patterns against the background of ambiguity in future RBA actions.
Remember it is a currency pair. When we trade it, we also trade our base currency opponent.
For the Australian against the US dollar, the USD portion I think will remain choppy, but you'll also need to pay attention to technical levels. Risk mood will also need to be taken into account in the trade negotiations.
In the Australian against the yen, the situation is almost the same, with AUD / JPY also above the 200-day moving average. However, the yen's crosses are also influenced by the risk sentiment and the yield on government securities.
A big risky event is coming up in January - the signing ceremony for Phase I Deal between China and the US.
In AUD vs NZD, the pair remains below 1.05 but cannot continue below 1.04. If interest rates are cut by the RBA in February, it could be the catalyst to move the AUD / NZD below 1.04 and to 1.03, bringing the cross to the low levels of August.

Graphs: Used with permission of Bloomberg Finance L.P.
 Trader Martin Nikolov
 Read more:


If you think, we can improve that section,
please comment. Your oppinion is imortant for us.

