

- Home
- >
- Commodities Daily Forecasts
- >
- CL: Price action signal for short

CL: Price action signal for short

Rating:

CL: 10.10.2016
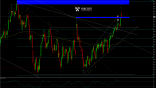
Daily chart - Long term upward trend, mid - term choppy, short-term downward movement. Two equal candles at horizontal and diagonal resistance and price close to diagonal and horizontal resistance.
Price action сигнал - Two equal candles - signal for downward movement
Indicators:
CCI(50) - in overbought area and tuning - negative signal
DeM(14) - in overbought area. When turning this will give us a signal for short.
SL: 51.20
Alternative scenario: If the price goes above the horizontal and diagonal resistance and makes a new peak, the negative scenario will change toward positive.
Jr_Trader_Sabriev
 Varchev Traders
 Read more:


RECCOMEND
WAS THIS POST USEFUL FOR YOU?
If you think, we can improve that section,
please comment. Your oppinion is imortant for us.
If you think, we can improve that section,
please comment. Your oppinion is imortant for us.

