

- Home
- >
- Commodities Daily Forecasts
- >
- Gold fell below $1500 mark

Gold fell below $1500 mark
Rating:

- Fed rate cut expectations helped gain some traction on Monday.
- US-China trade optimism/positive US bond yields capped gains.
Gold refreshed daily tops during the early European session, albeit lacked any strong bullish conviction and remained well below three-week tops set on Friday.
The precious metal failed to capitalize on its goodish intraday positive move on Friday, rather witnessed some selling near the $1520 region amid fading safe-haven demand. This coupled with a late pickup in the US Dollar demand exerted some additional downward pressure on the dollar-denominated Gold.
Meanwhile, expectations that the Fed will cut interest rates further at its upcoming meeting on October 29-30 helped the non-yielding yellow metal to regain some positive traction on Monday. However, a combination of negative forces kept a lid on any strong follow-through move up, at least for now.
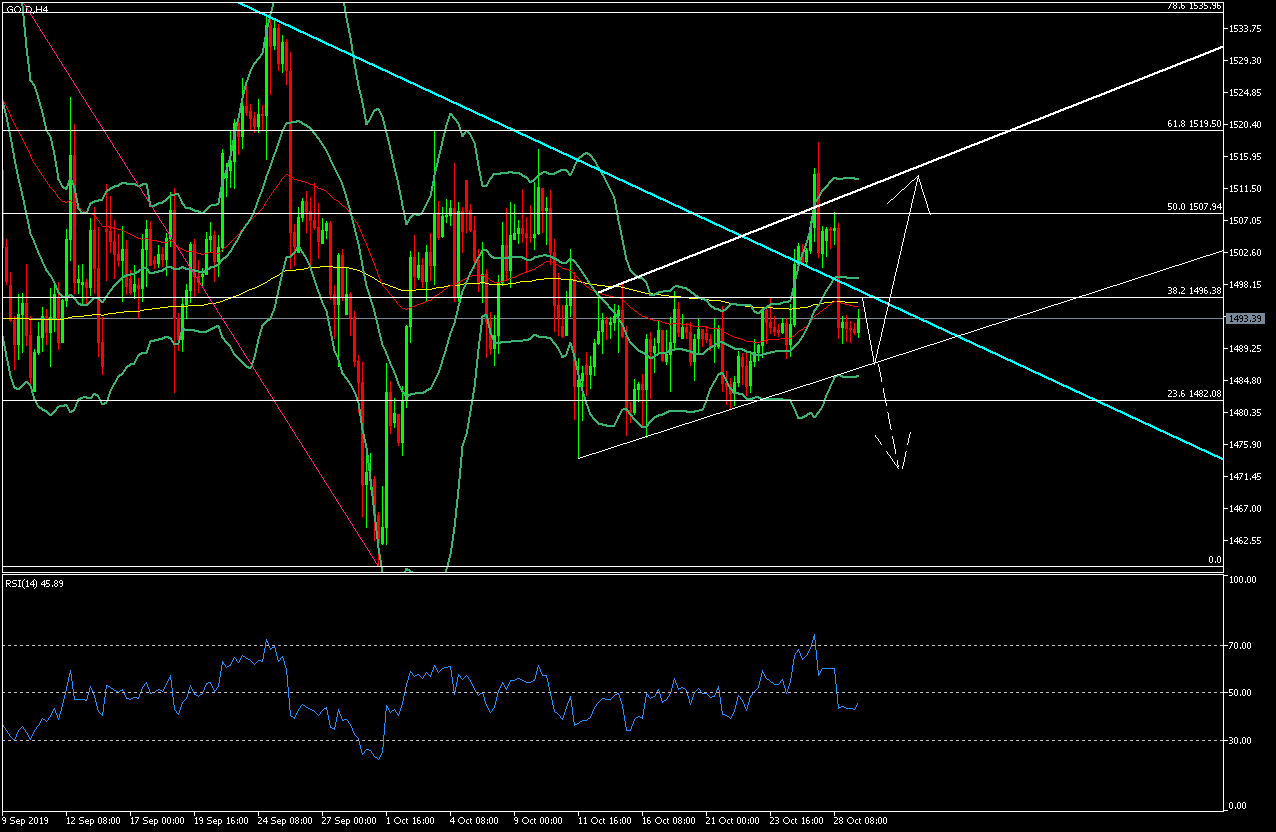
From a technical point of view, the price was able to return below the resistance of the short-term uptrend channel (White trend lines), but remained above the strong resistance (light blue trend line).
On a weekly chart, the price has formed a price action formation, suggesting that a long-term upward movement is possible.
50 and 200 period averages and the middle bollinger line play a resistance role.
RSI is coming out of overbought territory and now is below 50% which suggests that the downward movement is almost complete.
Option 1: The price reaches the broken resistance (the light blue trend line) whereby the price action formation confirms the breakthrough. With this option, the price will continue in an upward direction. (This option is no longer valid since the price broke below the support/resistance.)
Option 2: Price breaks the average of the bollinger and the diagonal. In this option a drop to the lower of the bollinger and white diagonal support is possible. From there on, if the price action formation is pointing for another appreciation we can enter in long positions.
Alternatively, if the price breaks the last support we see a drop for the previous bottom at $ 1460, and if it breaks, the price will continue in a downward direction for the test at $ 1440

 Trader Milko Zashev
 Read more:


If you think, we can improve that section,
please comment. Your oppinion is imortant for us.

