

- Home
- >
- Commodities Daily Forecasts
- >
- NGZ6: Possible new long after correction down to Fib 61.8%

NGZ6: Possible new long after correction down to Fib 61.8%
Rating:

NGZ6:
Date: 31 October, 2016
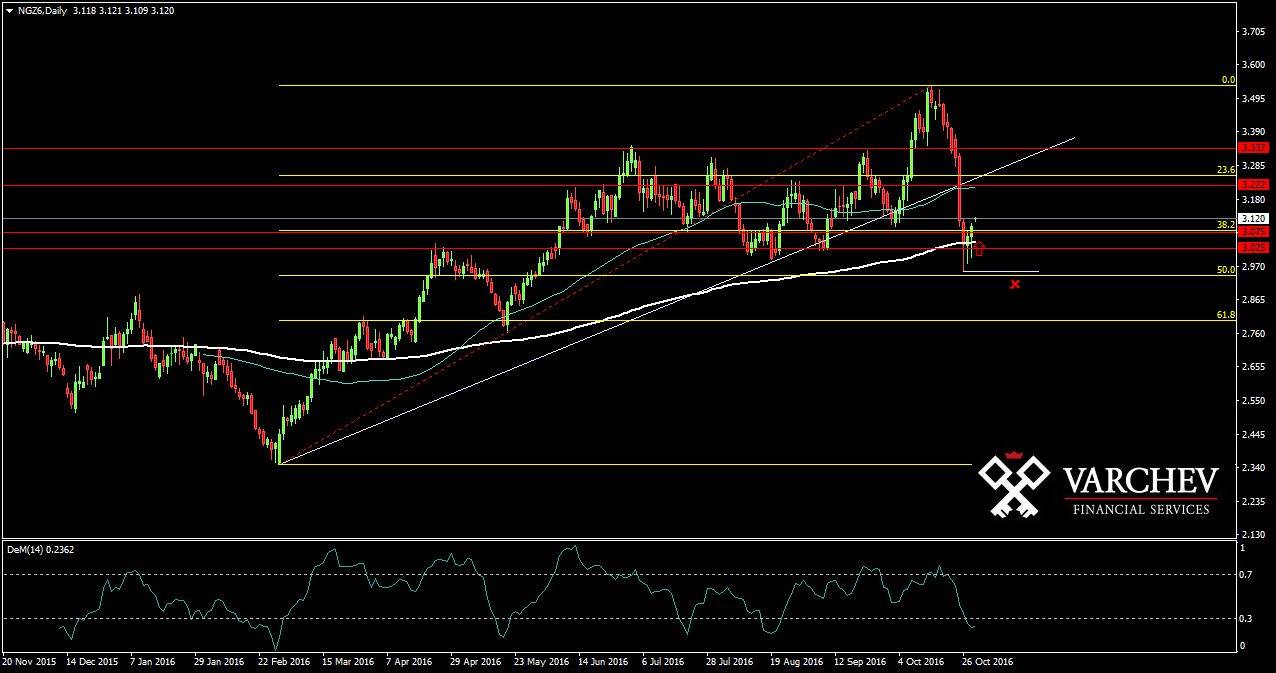
D1 Graph: Long Trend
Price made a correction down to 61,8% and strong horizontal support. The correction was fast and strong, but now the price is trading again above the horizontal support and above the 200 EМА. The up trend ling has been broken but the horizontal S/R levels and lines are much stronger than the diagonal ones. In our view trend remains up.

Alternative scenario: If the price breaks below the previous low and below the 200 EМА, this will cancel the bullish view.
Technical Indicator:
DEM (14) - In the oversold zone and turned up for long
Pirce Entry for long around: 3.000
SL: 2.8900
Jr. Trader - S. Fuchedzhiev
 Varchev Traders
 Read more:


RECCOMEND
WAS THIS POST USEFUL FOR YOU?
If you think, we can improve that section,
please comment. Your oppinion is imortant for us.
If you think, we can improve that section,
please comment. Your oppinion is imortant for us.

