

- Home
- >
- Commodities Daily Forecasts
- >
- OIL : levels of resistance , possible decrease

OIL : levels of resistance , possible decrease
Rating:

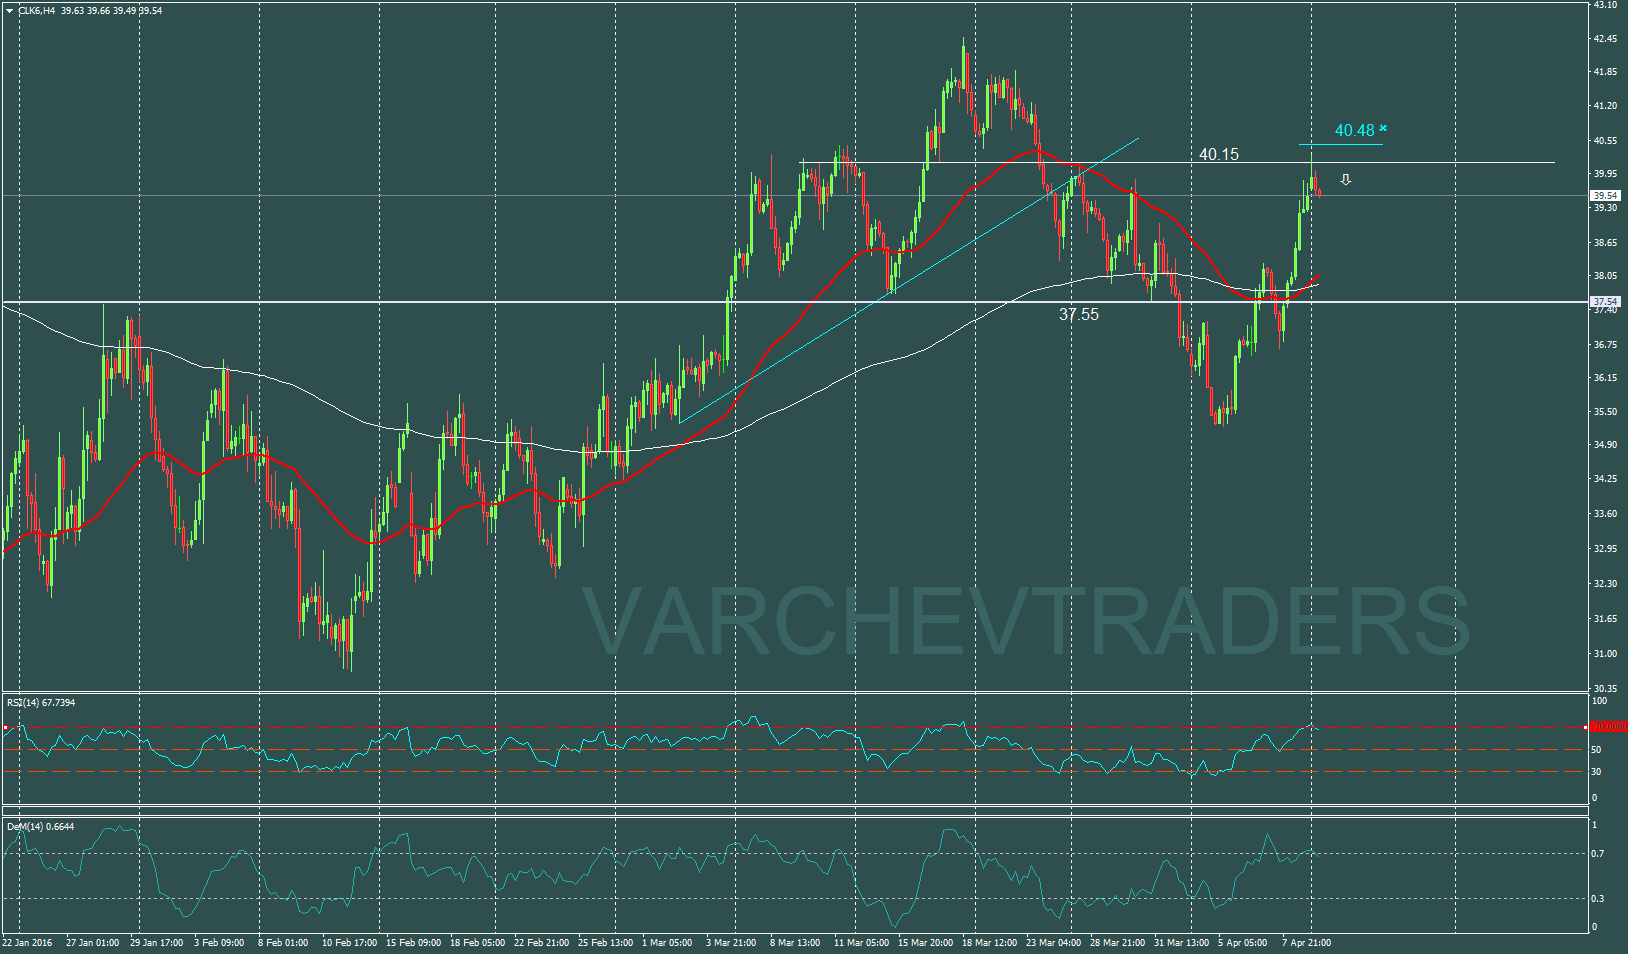
OIL: H4 graph , ascending trend
Price at levels of horizontal resistance 40.15 usd
Price action : Pin bar at levels of resistance
Engulfing candle after the pin , negative signal
Divergence with DeM : lower top in the indicator , higher top in the chart
Indicators :
DeM goes below 70 after divergence – strong negative signal
RSI going under 70 – negative signal
Alternative scenario :
If the price go over the pin bar will negate the formation
Head of stocks trading – S.Angelov
 Varchev Traders
 Read more:


RECCOMEND
WAS THIS POST USEFUL FOR YOU?
If you think, we can improve that section,
please comment. Your oppinion is imortant for us.
If you think, we can improve that section,
please comment. Your oppinion is imortant for us.

