

- Home
- >
- Commodities Daily Forecasts
- >
- There Is Panic Slowly Building in the Stock Market – Here Are the Signs You Need to Know

There Is Panic Slowly Building in the Stock Market - Here Are the Signs You Need to Know
Rating:

It isn't panic, but a sense of concern has become evident in the stock market.
The Volatility Index (VIX) is up over 7% this week, while gold is up about 6% over the past two weeks. Crude oil prices have reacted to renewed tensions in the Middle East and the SPDR S&P Metals and Mining ETF (XME) looks like it may have formed a triple bottom on its chart. The way to position for, or to play a potential shift in investor sentiment, may be in the precious metal and the gold mining stocks.

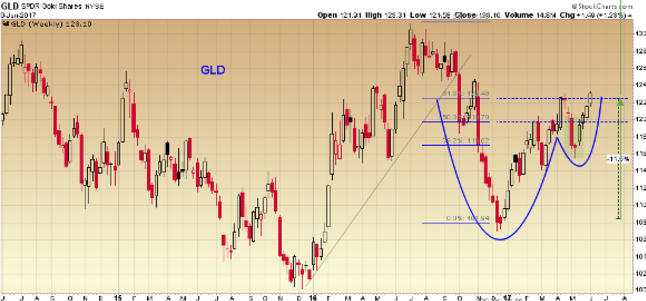
The weekly chart of the SPDR Gold Shares ETF ( GLD) shows the fund breaking below a long term uptrend line in September in 2016 and dropping 17% into the end of the year. That low turned out to be the bottom of a large cup and handle pattern with rim line resistance positioned at the 62% retracement level of the pullback.
The VanEck Vectors Gold Miners ETF (GDX) has been trading under a sharp downtrend line and above horizontal resistance in the $21.00 area this year, forming a triangle pattern on its weekly chart. It has moved back up to retest the trend line, currently intersecting with the 38% retracement level of its August 2016 high and December low.
A break above the cup and handle rim line on the SPDR Gold Shares ETF chart projects a pattern price target objective measured by taking the depth of the cup and adding it to the rim line, and suggests an 11% move higher. If the downtrend line is broken on the VanEck Vectors Gold Miners ETF chart, the triangle pattern projects a target price measured by taking the height of the triangle and adding it to the breakout point, and it projects a 17% move in the stock.
Source: Bloomberg Pro Terminal
Jr Trader Alexander Kumanov
 Varchev Traders
 Read more:


If you think, we can improve that section,
please comment. Your oppinion is imortant for us.

