

- Home
- >
- Commodities Daily Forecasts
- >
- WTI with “sell” capabilities from current levels

WTI with "sell" capabilities from current levels
Rating:

WTI
Time frame: H4
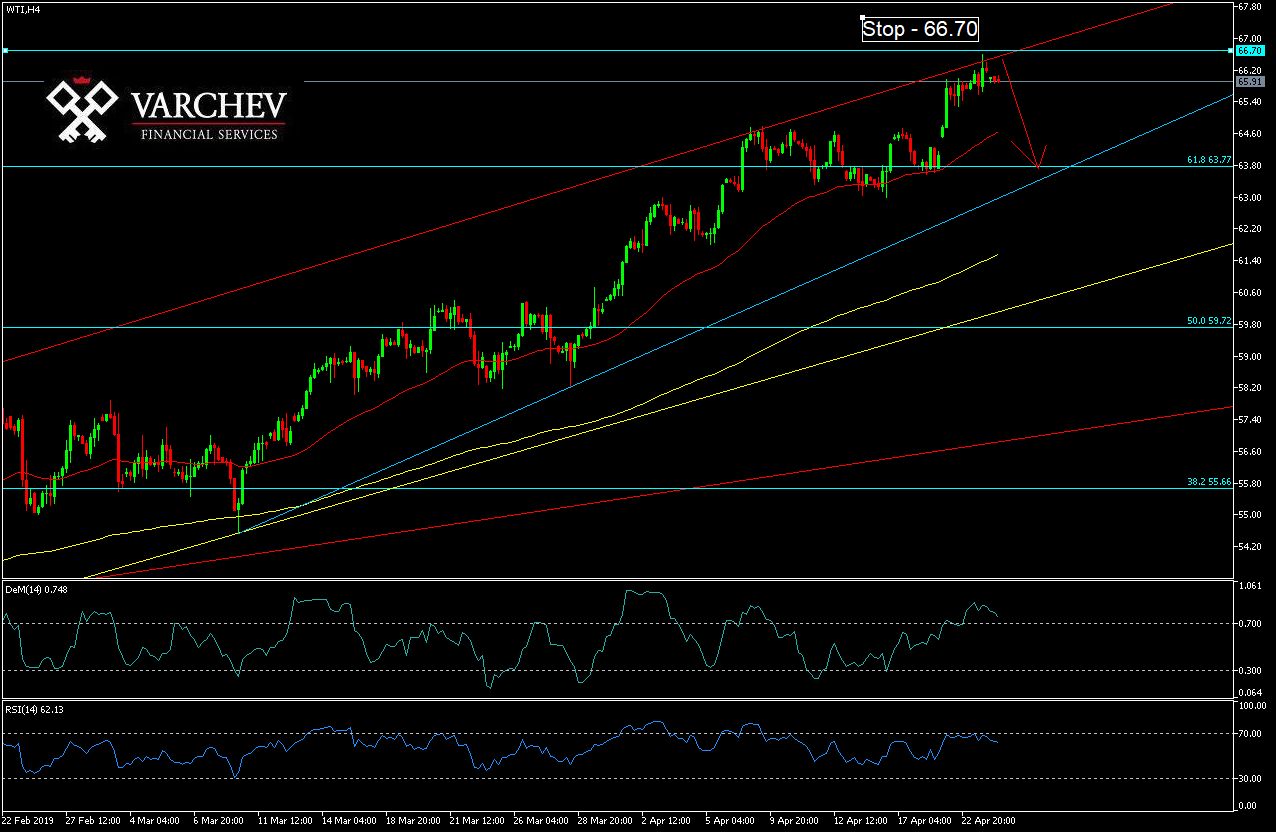
Technical analysis: The chart shows that the price of oil is moving in a strong upward trend. After the price made a bottom at 54.80, she headed north, easily knocking 61.8% on Fibonacci, designed from the top to the bottom of last year's downward movement. The oil managed to record a peak at 64.80, then slightly corrected and headed north again. The price made a 2nd high, while the DeM and RSI indicators show the presence of divergence (slowing up the upward movement). At the same time, the price is at a strong diagonal resistance, which is an additional indication that the price could change its direction from here.
Indicators: The price is over 200 and 50 EMA, which play a role of strong support at this stage.
DeM and RSI show the presence of divergence that supports the "sell" scenario.
Entry into Deal: From current levels.
Alternative scenario: If the price can keep the current levels and break through strong diagonal support, then the price will continue its upward movement until the next significant resistance around 68.00
 Trader Milko Zashev
 Read more:


If you think, we can improve that section,
please comment. Your oppinion is imortant for us.

